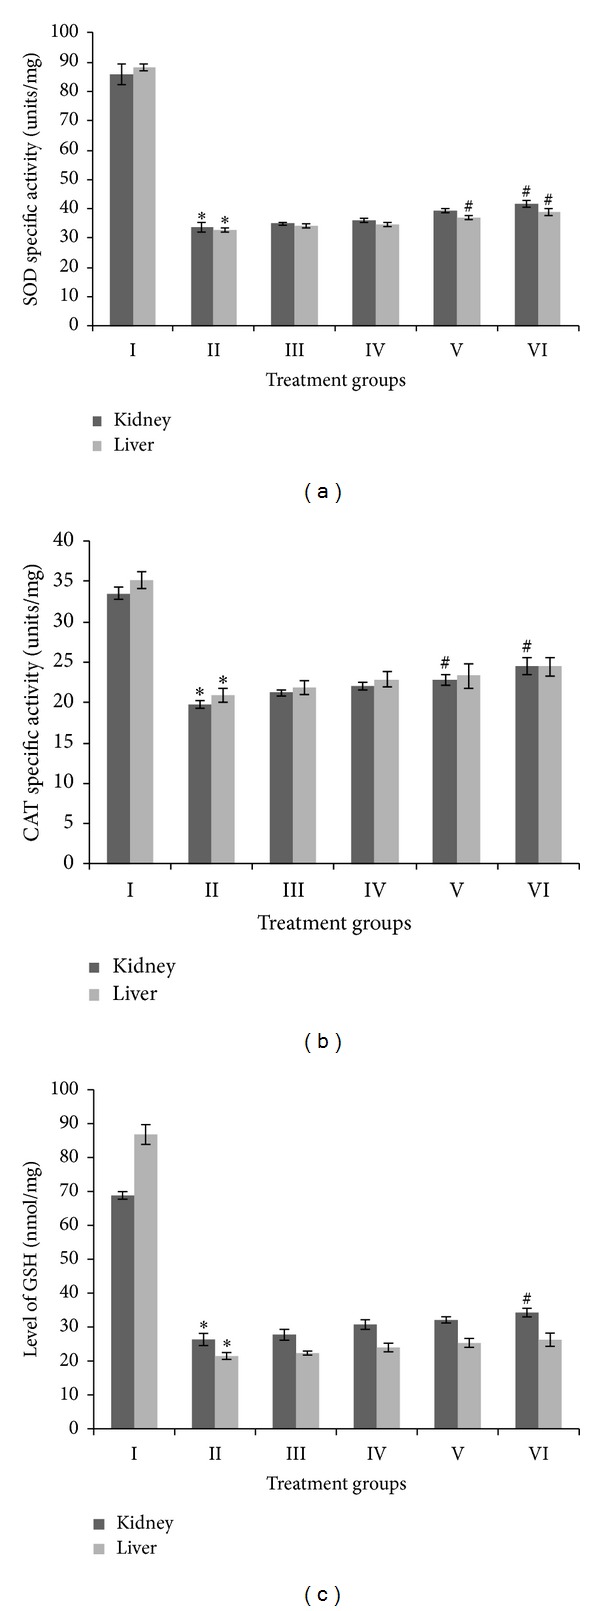
Figure 3.

Level of specific activity of superoxide dismutase (SOD) in kidney and liver samples, expressed in enzyme units per milligram of protein (a), level of specific activity of catalase (CAT), expressed in enzyme units per milligram of protein (b), and level of reduced glutathione (GSH), expressed in enzyme nanomoles per milligram of protein (c). ∗ indicates significantly different from control. # indicates significantly different from group II.
