Figure 4.

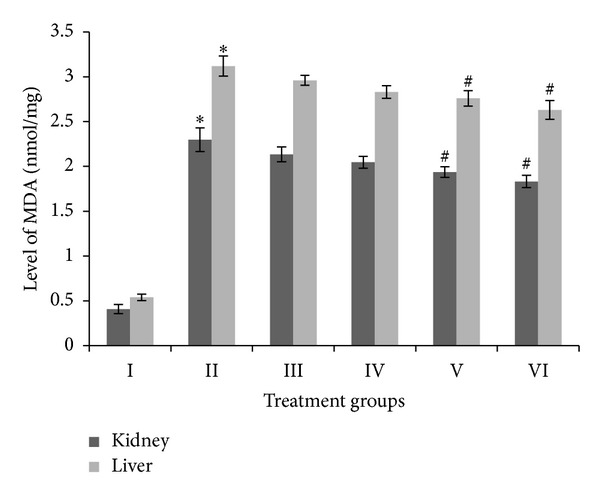
Level of malondialdehyde (MDA), expressed in enzyme nanomoles per milligram of kidney and liver samples. ∗ indicates significantly different from control. # indicates significantly different from group II.

Level of malondialdehyde (MDA), expressed in enzyme nanomoles per milligram of kidney and liver samples. ∗ indicates significantly different from control. # indicates significantly different from group II.