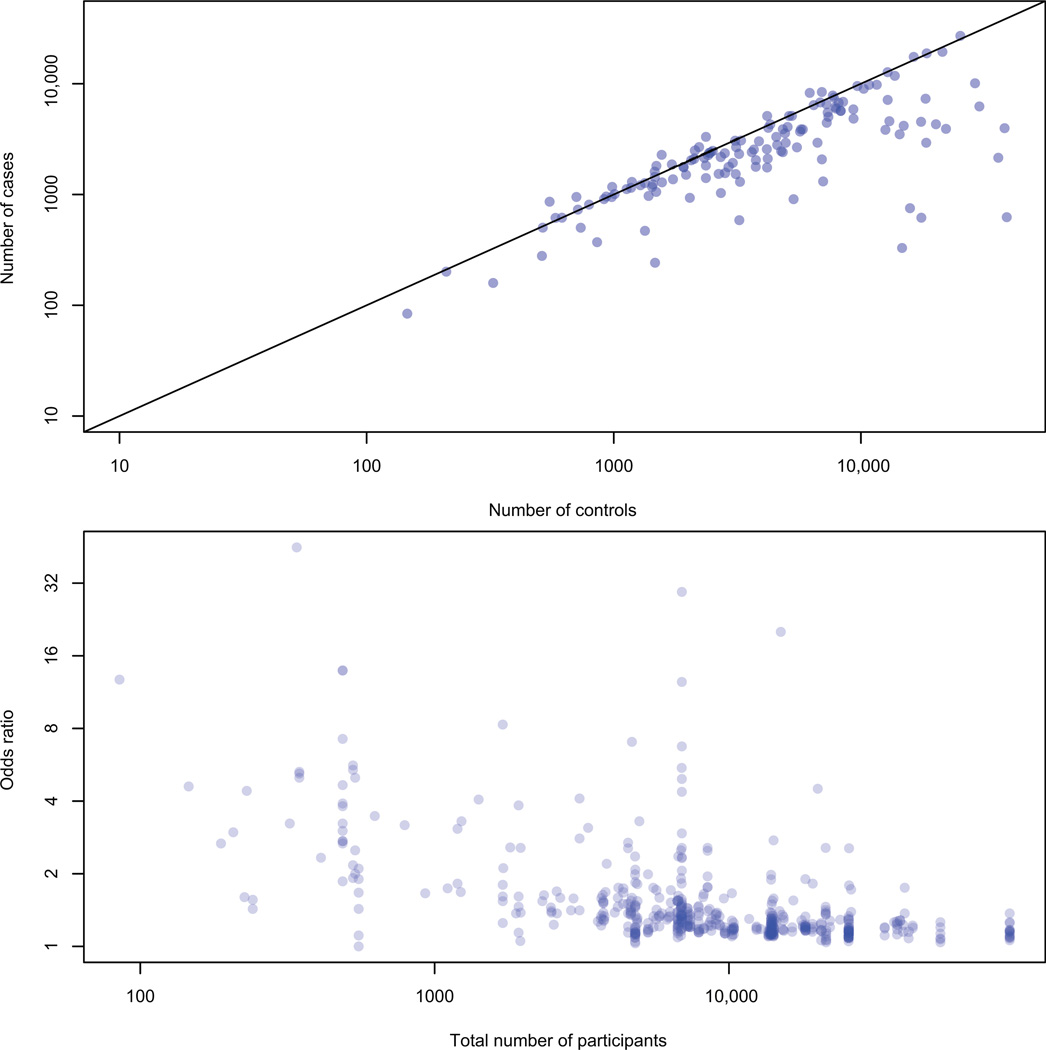
Figure 3.
Top panel: number of cases and controls in each published GWA study; many GWAS have fewer cases than controls. Bottom panel: total GWA study sample size (cases and controls) versus effect size for studies of binary traits; larger studies are better powered to detect smaller odds ratios (19).

