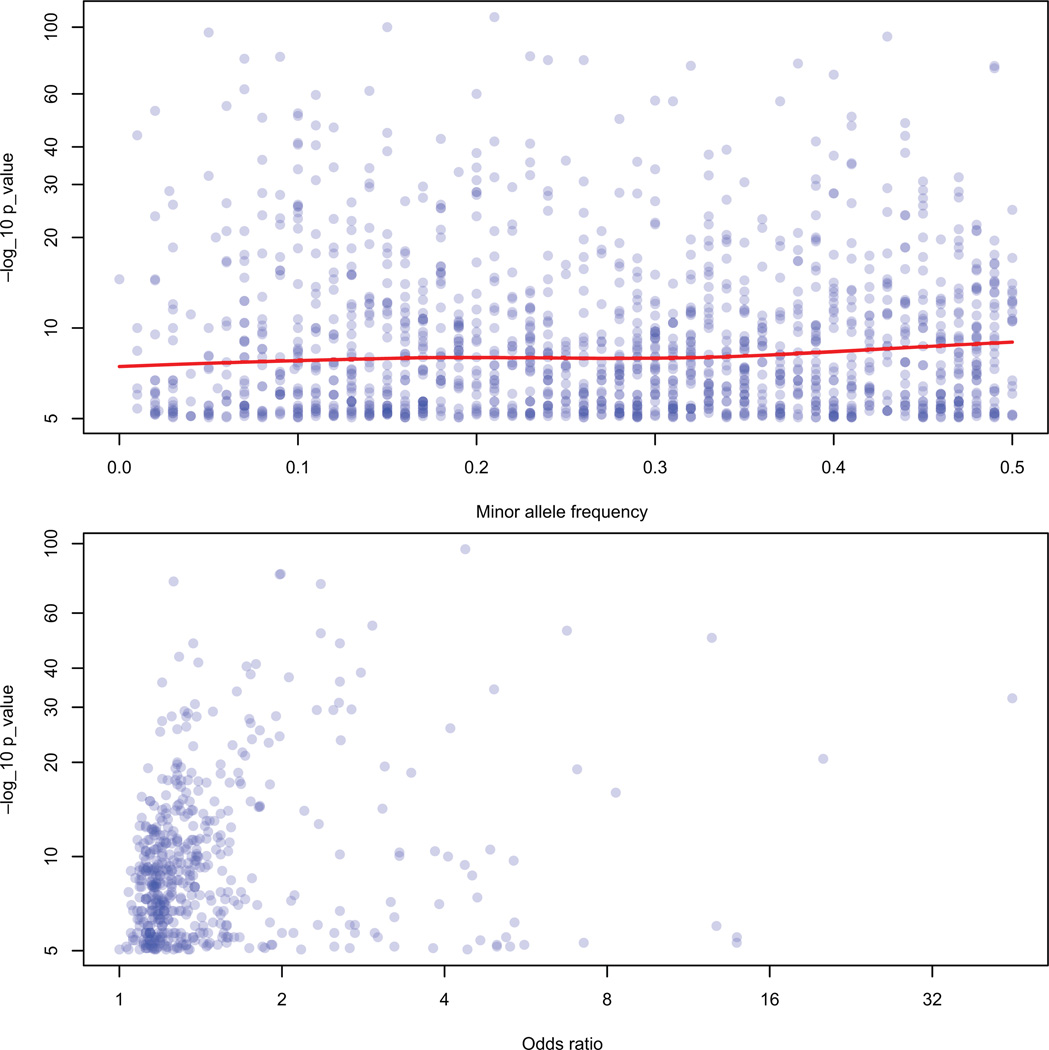
Figure 4.
Top panel: GWA study p-values and associated SNP minor allele frequencies (MAF). The red line is a smoothed curve across these values and highlights that there is little impact of MAF on p-values for the strongest SNPs from GWAS. Bottom panel: GWA study p-values and corresponding odds ratios. There is a slight trend toward smaller odds ratios having smaller p-values (19).

