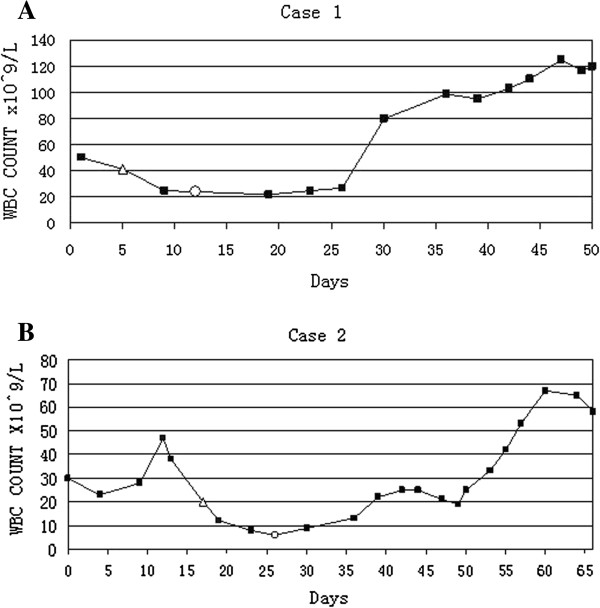
Figure 3.

WBC count graphs showing WBC count was record down when patients were admitted to hospital. A. WBC gradually increased postoperatively. Δ represents the first day patient underwent radical nephrectomy. ○ represents the day patient was discharged from hospital. B. WBC count gradually increased postoperatively. Δ represents the first day the patient underwent radical nephrectomy. ○ represents the day the patient was discharged from hospital. L, liter; WBC, white blood count.
