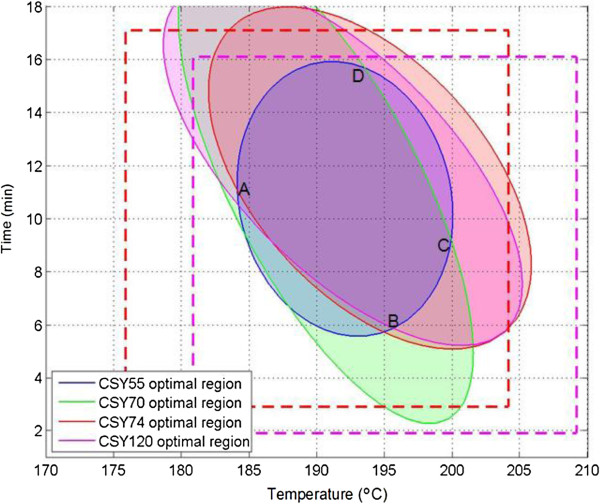
Figure 4.
Contour plots showing the pretreatment conditions that provide 95% of the maximum combined sugar yield. The yield is expressed as gram per 100 g dry bagasse. The dotted lines represent the input range of the independent variables for the cultivars: red for varieties 55, 70 and 74; pink for bagasse 120. Area A, B, C and D is the intersection area that shows a common range of pretreatment conditions that provide 95% of the maximum combined sugar yield for all varieties. CSY, combined sugar yield.

