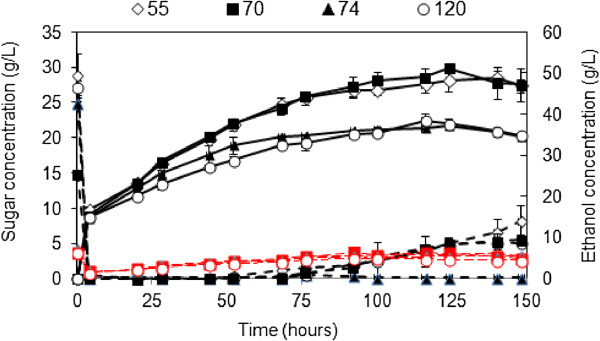
Figure 6.

Glucose xylose and ethanol concentrations (g/L) during fed-batch SSF of dilute acid pretreated bagasse samples. Glucose (in dotted lines in black), xylose (dashed lines in red) and ethanol (in solid lines). Solid loading (16% (w/w)) and at enzyme dosage (0.15 mL of Cellic Ctec2/g WIS and 0.213 mL of Cellic Htec2/g WIS). Samples were pretreated based on optimum conditions for maximum combined sugar yield.
