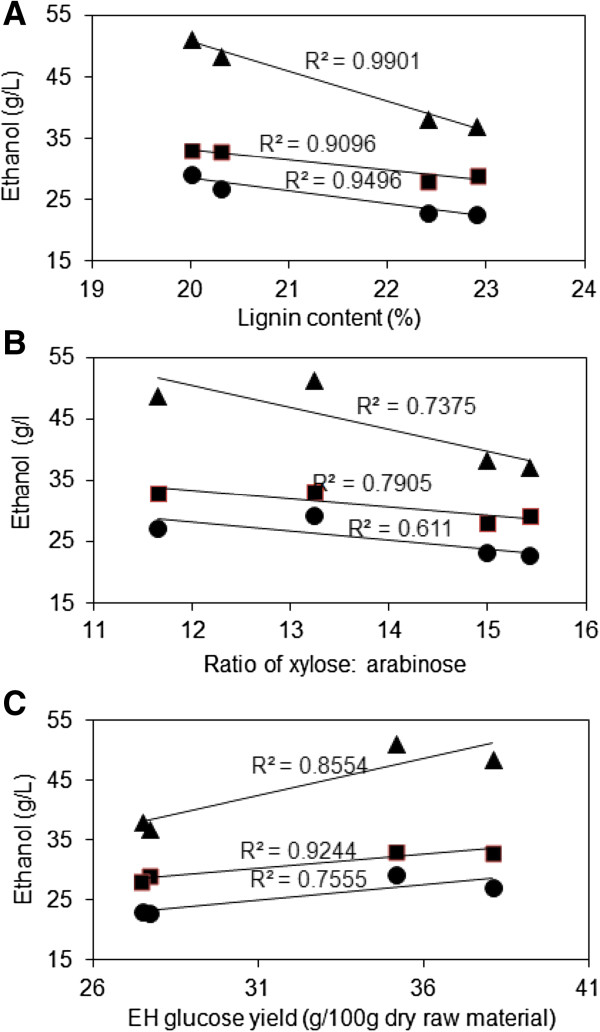
Figure 7.
Correlations between the highest ethanol concentration and lignin, ratio of xylose: arabinose, glucose yield. (A) Relationship between lignin and ethanol concentration, (B) Relationship between the ratio of xylose to arabinose and ethanol concentration, (C) Relationship between glucose yield after enzymatic hydrolysis and ethanol concentration. Circle and rectangle markers represent ethanol concentration at low and high enzymes loadings for batch process, whereas triangular markers show the ethanol concentration during fed-batch process.

