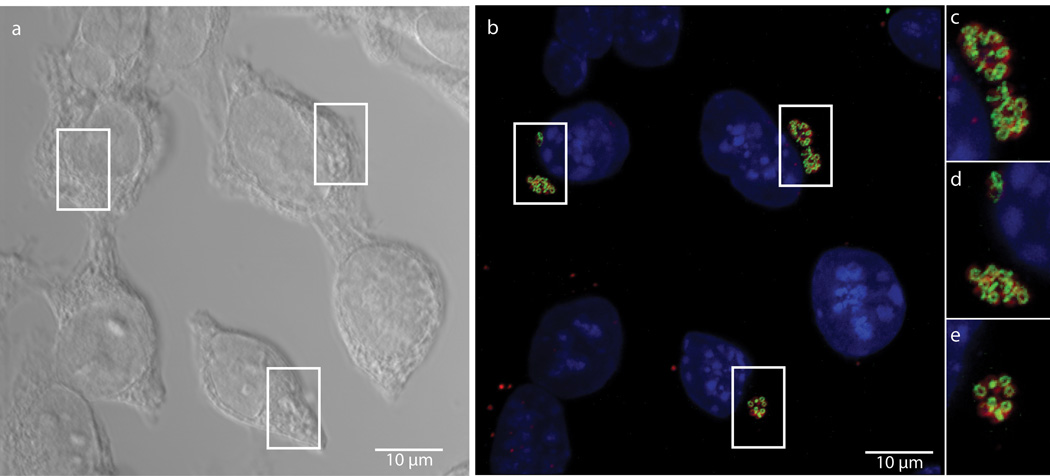
Figure 2. Fluorescent labeling of intracellular C. trachomatis PG.
Differential interference contrast (DIC) (a) and fluorescent (b–e) microscopy of L2 cells infected for 18 hours with C. trachomatis in the presence of the dipeptide probe EDA-DA (1 mM). Subsequent binding of the probe to an azide modified Alexa Fluor 488 (green) was achieved via click chemistry. Antibody to MOMP (red) was used to label chlamydial EBs and RBs. DAPI (blue) was used for nuclear staining. Panels B–E show a merge of all three fluorescent channels. Boxes indicate location of chlamydial inclusions, and magnification of the boxes is provided in panels c–e. Fluorescent images are maximum intensity projections of deconvoluted zstacks. Three dimensional renderings are provided in the supplemental materials (Videos S1 and S2).

