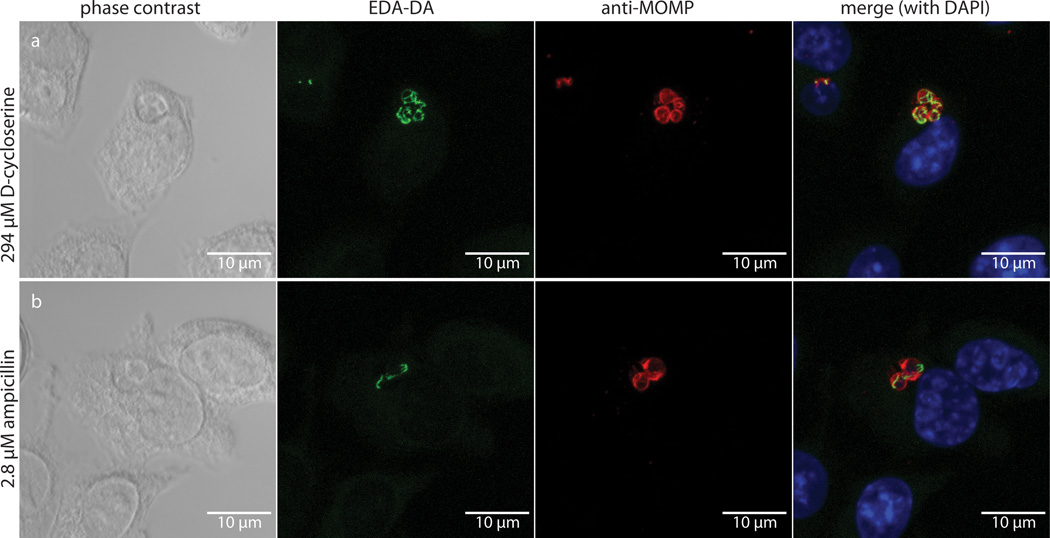
Figure 3. Labeling in the presence of PG synthesis inhibitors.
DIC and fluorescent microscopy of infected L2 cells 18 hours post infection in the presence of 1 mM EDA-DA and either (a) D-cycloserine (DCS) or (b) ampicillin (AMP). Labeling was conducted as described in the Figure 2 legend. A merge of all three fluorescent channels is presented in the right hand panels. Fluorescent images are maximum intensity projections of zstacks and three dimensional renderings are provided in the supplemental materials (Videos S3 and S4).

