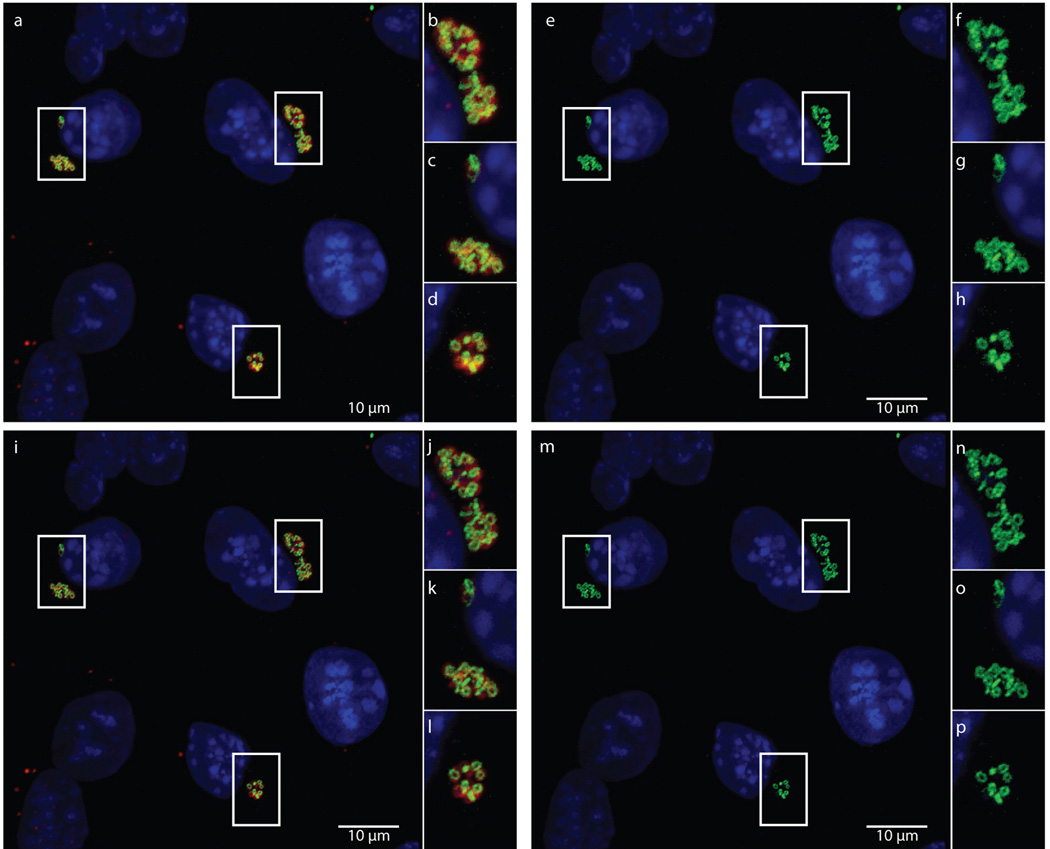
Extended Data Figure 5. Maximum intensity projections of confocal zstacks before and after deconvolution.
Raw data used for generating Figure 2, showing merged (a–d) and green (e–h) channels are compared with the same maximum intensity projections from zstacks that have undergone deconvolution, (i–l) and (m–p), respectively.

