
Figure 3.
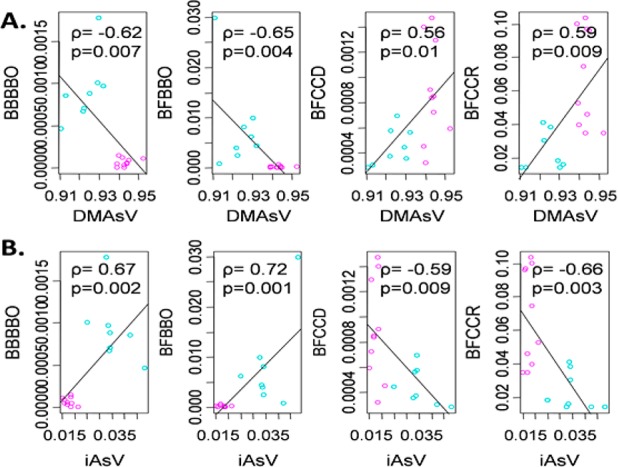
Correlation plots, calculated by Pearson’s correlation coefficient, demonstrating the functional correlation between altered gut bacteria families (relative abundance given on the y axis) and DMAsV (A) and iAsV (B) (relative abundance given on the x axis) (BBBBO: p_Bacteroidetes, c_Bacteroidia, o_Bacteroidales, and other; BFBBO: p_Firmicutes, c_Bacilli, o_Bacillales, and other; BFCCD: p_Firmicutes, c_Clostridia, o_Clostridiales, and f_Dehalobacteriaceae; and BFCCR: p_Firmicutes, c_Clostridia, o_Clostridiales, and f_Ruminococcaceae).