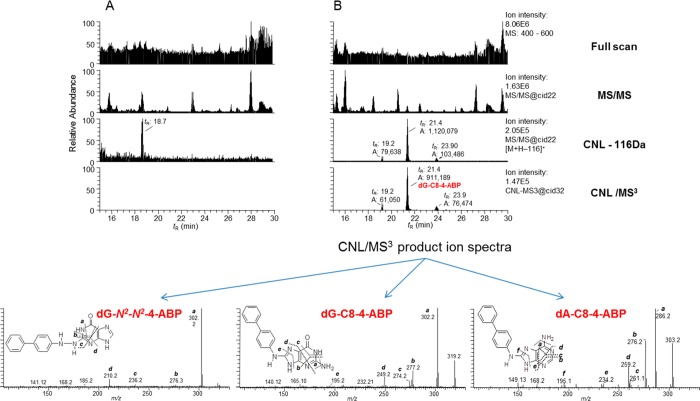
Figure 7.
Example of a method used to screen for DNA adducts in human hepatocytes using data-dependent constant neutral loss–triple stage mass spectrometry performed on a linear quadrupole ion trap mass spectrometer. (A) Chromatograms obtained upon analysis of an untreated sample. (B) Chromatograms obtained upon analysis of a 4-ABP-treated sample; the [M + H – 116]+ ion, within the top 10 most abundant fragment ions in the MS/MS spectrum, triggers the acquisition of the MS3 spectrum, providing structural information on the detected DNA modifications. The full scan and MS/MS chromatograms are complex and show many features; however, the chromatogram displaying the ions that underwent a loss of 116 amu and the CNL-MS3 chromatogram are greatly simplified. Adapted from ref (71). Copyright 2009 American Chemical Society.

