
Figure 3.
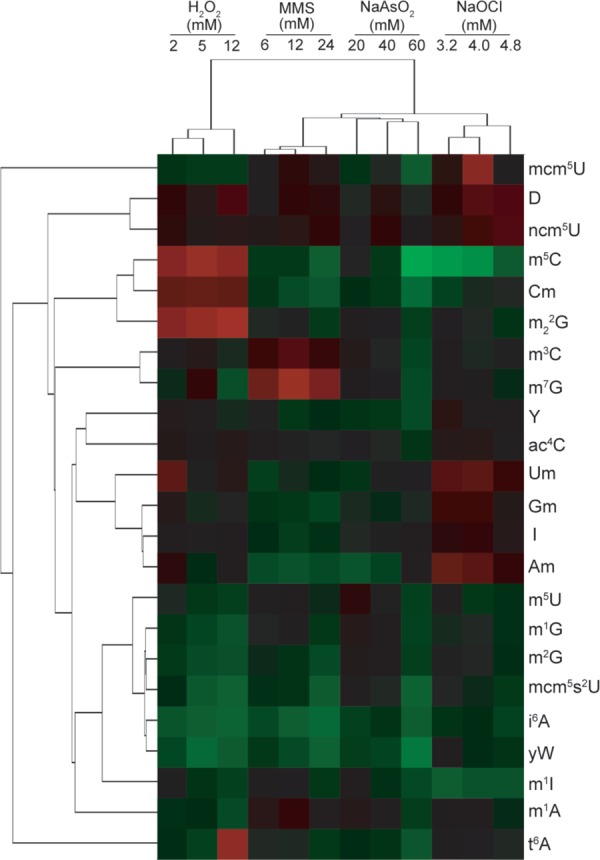
Hierarchical clustering of exposure- and genetic-induced changes in RNA modification levels. RNA modification data from wild-type cells exposed to different agents and mock-treated cells were identified and quantitated by mass spectrometry. Log-based fold-change values were determined relative to untreated, wild-type cells, and these data where hierarchically clustered. Image reproduced from ref (27).