
Figure 6.
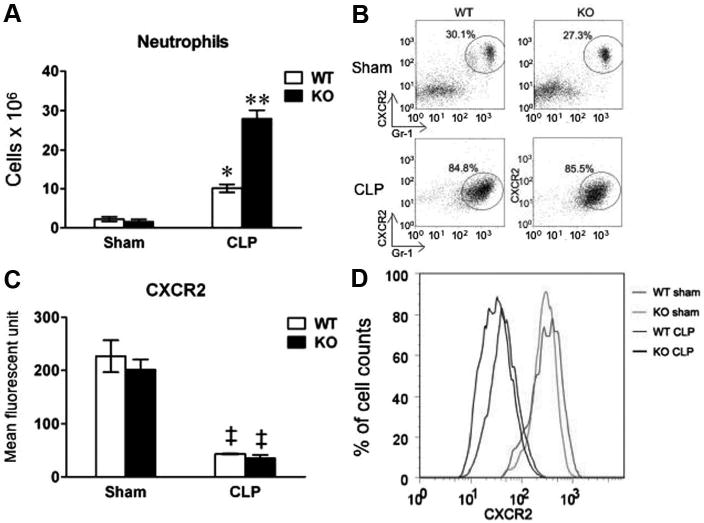
Peritoneal neutrophil recruitment and chemokine expression after cecum ligation and puncture (CLP). Mice underwent sham or CLP procedures. Twenty-four hours later, peritoneal cells were harvested from lavage fluid and manually counted. The same numbers of cells (5 × 10⁵) from each mouse were loaded for fluorescence-activated cell-sorting (FACS) analysis. A, Total peritoneal neutrophils in the peritoneum. Neutrophil numbers were calculated based on the total cells numbers manually counted multiplied by the percentage of neutrophils as measured by FACS. Each error bar represents mean ± se of four mice. *p < .05 vs. the sham mice; **p = .001 vs. wild-type (WT) CLP. B, A representative example of FACS plots of peritoneal neutrophils from WT and toll-like receptor 2 (TLR2)−/− mice. The cells were gated on CXCR2 (chemokine receptor) and GR-1 (neutrophil marker). The cells within the circle represent neutrophils. The percentage of neutrophils is shown. C, CXCR2 expression on neutrophils recruited to the peritoneum in WT and TLR2−/− mice. Each error bar represents mean ± se of four mice. ‡p < .001 vs. the sham mice. D, A representative example of FACS of neutrophil CXCR2 expression in WT sham (red), TLR2−/− sham (green), WT CLP (blue), and TLR2−/− CLP mice (black). KO, knockout (TLR2−/−).