
Figure 3.
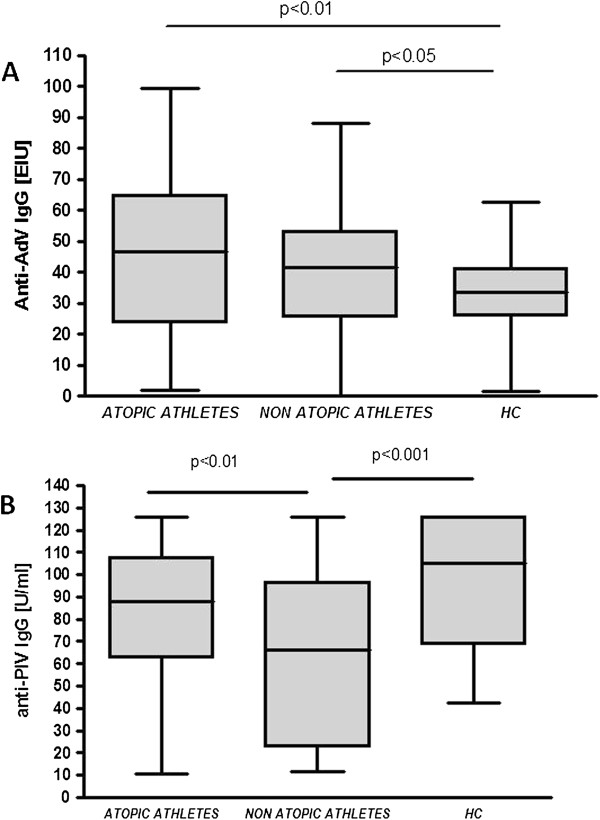
Box and whisker plots presenting serum anti-AdV1,2,3 (panel A) and serum anti-PIV (panel B) IgG levels in athletes and healthy controls (HC). Ends of whiskers present minimum and maximum values in each group; PIV, parainfluenza virus; AdV, adenovirus.