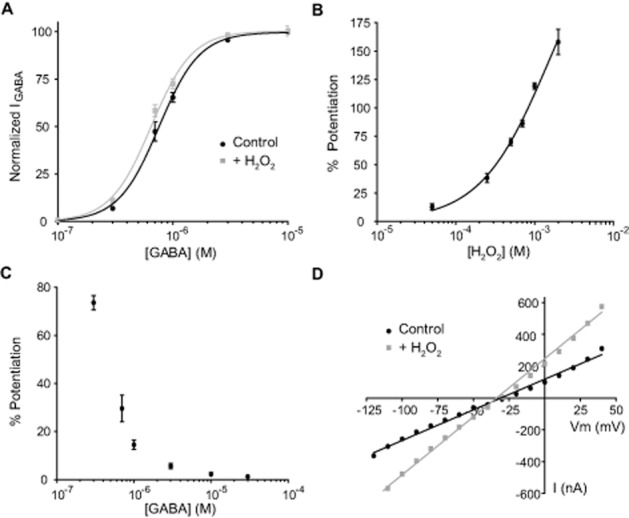
Figure 2.

Analysis of H2O2 effects on GABAAρ1 receptors. (A) C-R curves for GABA in the absence (control) or presence of H2O2 (500 μM). Response amplitudes were expressed as fraction of 30 μM GABA-evoked currents (maximal response). (B) Potentiation of GABAAρ1 receptors responses (0.3 μM GABA) by increasing concentrations of H2O2. (C) GABA concentration dependence of the induced H2O2 (500 μM) potentiation of GABAAρ1 receptors responses. (D) I-V relationship for GABAAρ1 receptors responses evoked by GABA (0.3 μM) in the absence or presence of H2O2 (500 μM).
