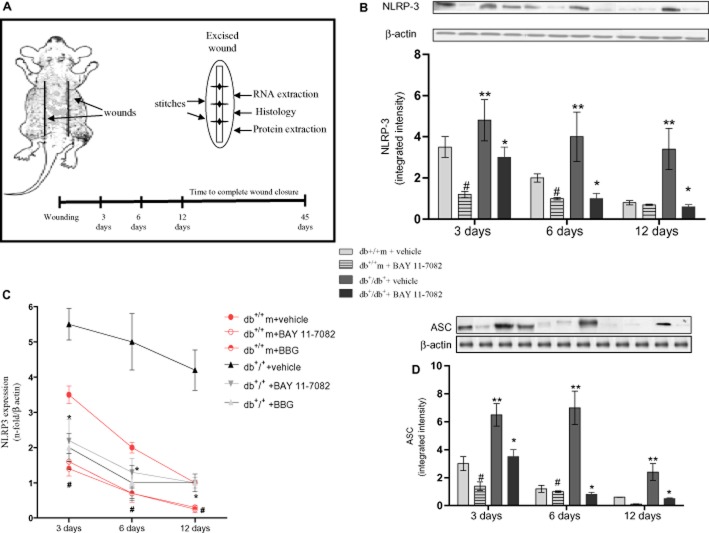
Figure 1.
(A) The diagram represents the back of a mouse with the site of the two wounds. The right hand side shows an excised wound (ellipse shape), subdivided to perform the analyses. At the bottom the experimental timeline is shown. (B) NLRP3 protein expression in skin wound samples, collected at 3, 6 and 12 days, from either normoglycaemic (db+/m+) and diabetic (db+/db+) mice, given either vehicle or BAY 11-7082 (20 mg·kg−1 i.p.). Each bar represents the mean ± SD of seven animals. #P < 0.01 versus db+/m+ + vehicle; **P < 0.01 versus db+/m+ + vehicle; *P < 0.05 versus db+/db+ + vehicle. (C) NLRP3 mRNA expression in skin wound samples, collected at 3, 6 and 12 days, from either normoglycaemic (db+/m+) and diabetic (db+/db+) mice, given either vehicle or BAY 11-7082 (20 mg·kg−1 i.p.) or BBG (45.5 mg·kg−1 i.p.). Each bar represents the mean ± SD of seven animals. #P < 0.01 versus db+/m+ + vehicle; *P < 0.05 versus db+/db+ + vehicle. (D) ASC protein expression in skin wound samples, collected at 3, 6 and 12 days, from either normoglycaemic (db+/m+) and diabetic (db+/db+) mice, given either vehicle or BAY 11-7082 (20 mg·kg−1 i.p.). Each bar represents the mean ± SD of seven animals. #P < 0.01 versus db+/m+ + vehicle; **P < 0.005 versus db+/m+ + vehicle; * P < 0.05 versus db+/db+ + vehicle.

