
Figure 3.
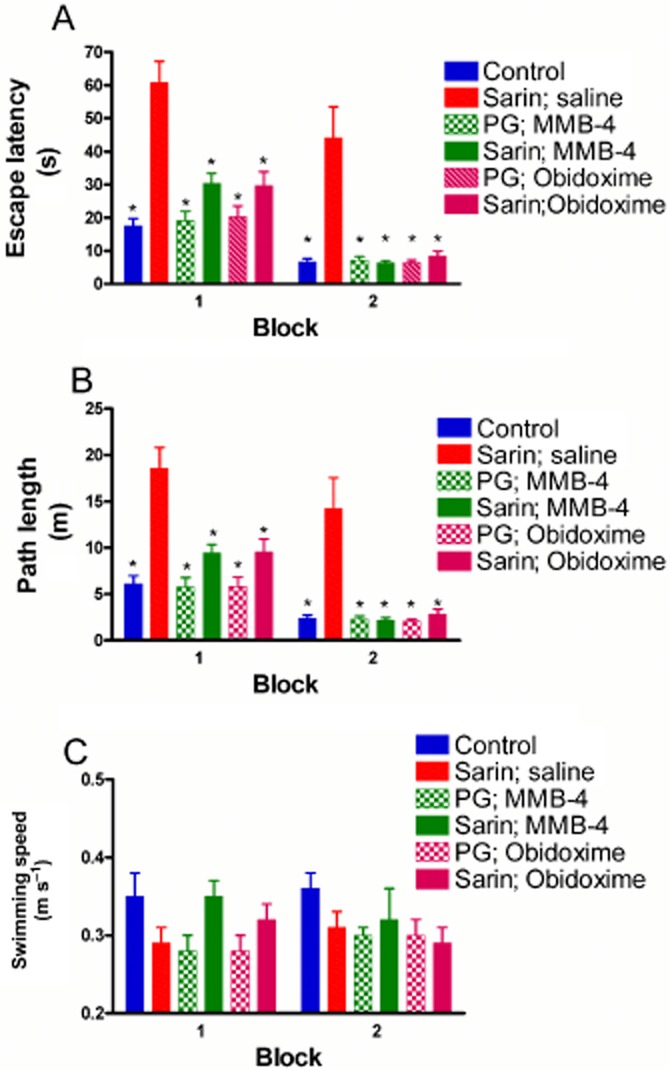
Visual performance test following topical sarin exposure and oxime treatment. Both eyes were topically exposed to 1 μg sarin or to 0.66% PG (control). Fifteen minutes following exposure, pupil diameter was measured to confirm pupil constriction (not shown). Eyes were then treated with saline or 2.5% oximes as indicated. Twenty minutes following treatment, visual performance was evaluated under controlled room light conditions (∼170 lux) using the cued MWM paradigm. The parameters examined and compared between groups were escape latency (A), path length (B) and swimming speed (C). The first block shows the average of the initial four trials of 12 rats, and the second block represents the following four trials average for the same animals. Differences in escape latency and path length between non-treated sarin-exposed group and each of the other groups are statistically significant (by manova) at a level of *P < 0.001 (vs. sarin; saline in the same block).