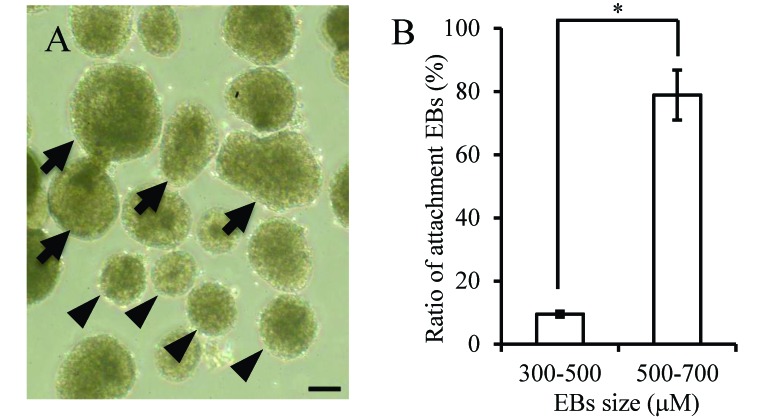
Figure 3.
EB derived from the Fld-ES cell line. (A) Arrows indicate EB of 500 to 700 µm; arrowheads indicate EB of 300 to 500 µm. (B) The rates of attachment were 78.9% and 9.5% for EB of 500 to 700 µm and 300 to 500 µm, respectively. Data are expressed as means ± 1 SD. An asterisk indicates a significant (P < 0.05) difference. Scale bar, 200 µm.

