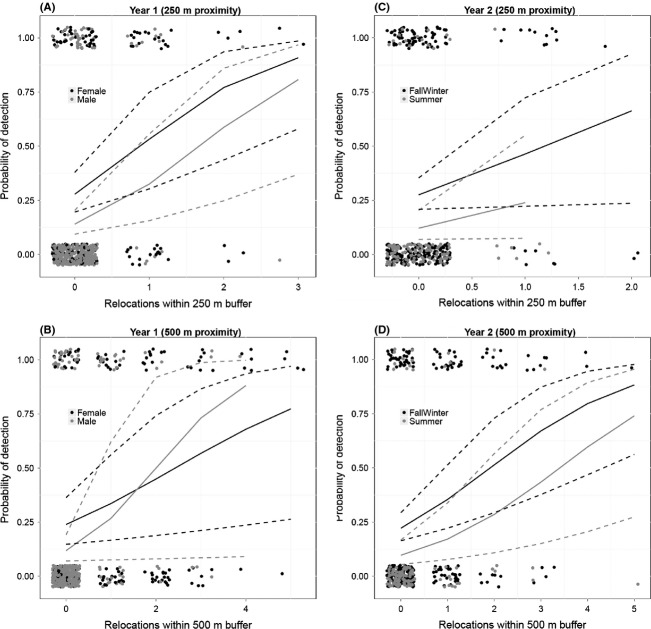
Figure 2.
Predicted probability of detection at camera traps of male and female fishers based on telemetry relocations within <250 m and <500 m from camera traps during Year 1 (A and B) and Year 2 (C and D), based on the best generalized linear mixed-effects models with a random effect for each fisher ([1 Fisher]) for each year and distance (see Table 2). Dots represent vertically and horizontally jittered binary detection/nondetection data. The solid lines are mean probability calculated using fixed effects only; dotted lines are 95% confidence intervals.

