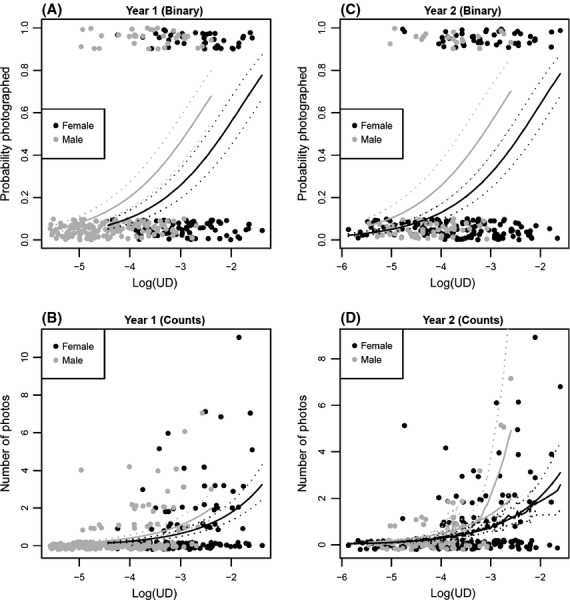
Figure 3.

Estimated models relating camera trap data to log(UD) of home ranges. For binary data (A and C), the simple model was selected (Sex + offset[log(UD)]). Model predictions are shown with gray (male) and black (female) solid lines, with dotted lines for 95% confidence intervals. For count data (B and D), the simple model was either selected or almost selected. The count models shown are for the quasi-Poisson GLM method. In Year 2 (D), the simple model is shown as smooth solid lines, and the selected model [Sex × Isopleth] is shown as jagged solid lines with dotted 95% confidence intervals, indicating that three male camera counts in high use areas support the more complex model. Binary data are plotted with a random vertical jitter.
