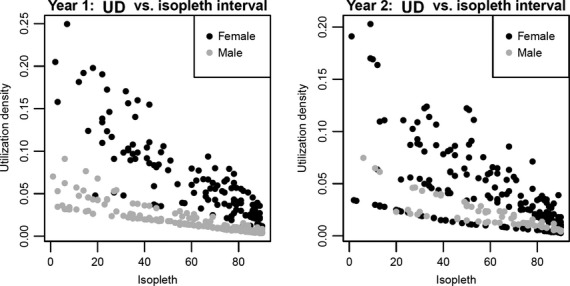
Figure 4.

Data showing how heterogeneity in home range sizes generates variation in the relationship between the utilization density (y-axis) and the isopleth percentile (x-axis). For example, the utilization density of one male in Year 1 at its 60% isopleth is similar to that of the 30% isopleth for another male.
