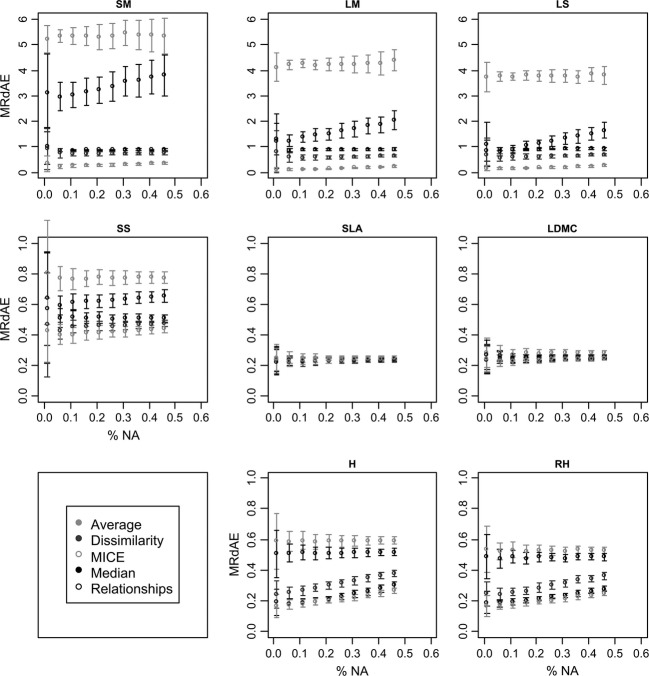
Figure 2.
Evolution of the MRdAE of five imputation methods in the herbaceous subdatabase with different percentages of missing data for eight traits (SM, seed mass; LM, leaf mass; LS, leaf surface; SS, seed shape; SLA, specific leaf area; LDMC, leaf dry matter content; H, vegetative height; RH, reproductive height). The mean of 100 simulations ± the standard deviation is shown for each percentage of missing data.

