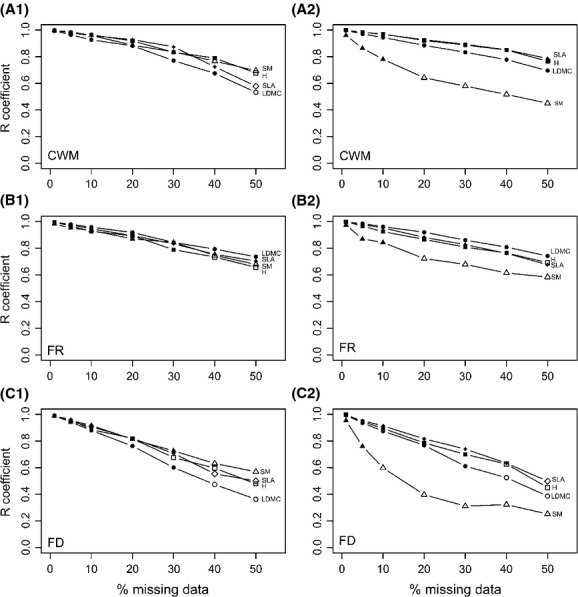
Figure 4.

Effect of percentage of missing data on the R Pearson's coefficient between functional diversity indices calculated without missing data and with imputed data (A) on the community-weighted mean (A1 with the dissimilarity method, A2 with the relationships method); (B) on the functional range (B1 with the dissimilarity method, B2 with the relationships method); (C) on the functional divergence index (C1 with the dissimilarity method, C2 with the relationships method). The formats of the dots represent the functional trait used for the computation of the indices: Triangle for the seed mass (SM), diamond for the specific leaf area (SLA), circle for the leaf dry matter content (LDMC), and square for the vegetative height (H). Full dots represent levels of percentage of missing data where at least 95% of the correlations were significant (P value < 0.05). Empty dots represent the simulation where less than 95% of the correlations were significant (P value < 0.05).
