
Figure 3.
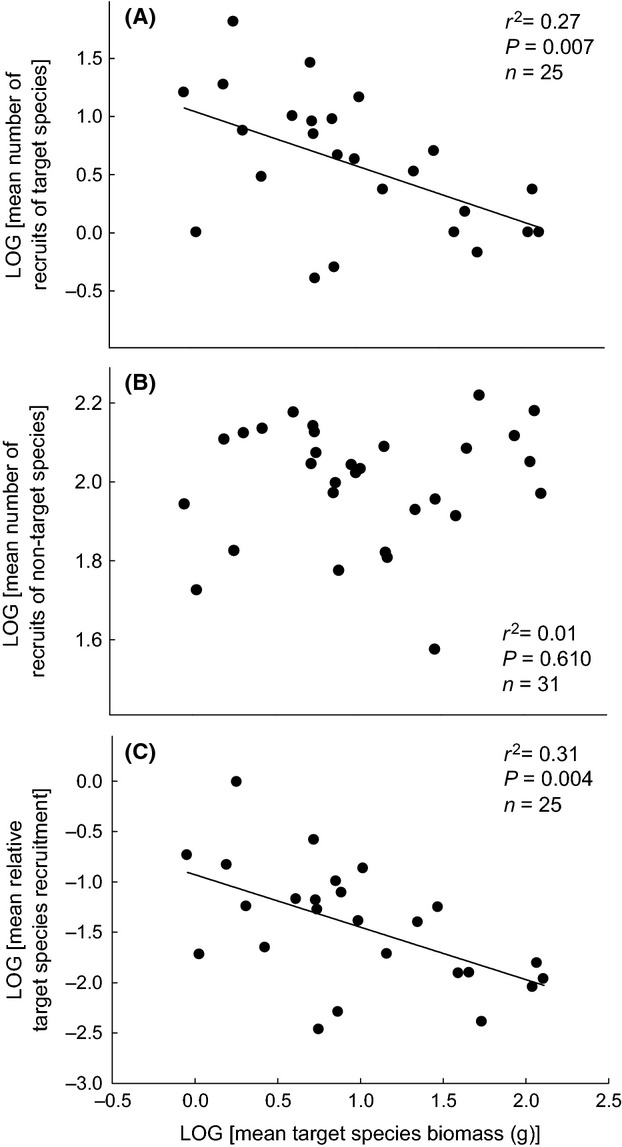
Recruitment success of resident species below cleared neighborhoods of target plants of different-sized resident species: Between-species relationships for mean (across-replicate) target species dry mass (g, aboveground) for individuals growing without competition from near neighbors (i.e., recorded in five replicate ‘vegetation removal’ plots) (x-axis) versus: (A) mean (across-replicate) number of recruits of target species within the target neighborhood 1 year after target harvest; (B) mean (across-replicate) number of recruits of nontarget species within the target neighborhood 1 year after target harvest; and (C) mean (across-replicate) relative target species recruitment, that is, (mean number of recruits of target species)/(mean number of recruits of nontarget species) within the target neighborhood 1 year after target harvest. Note that (A), (B), and (C) all have the same x-axis. All data are log-transformed. r2 and associated P-values are from Type I linear regression analyses. N values are less than 35 because target neighborhoods for some species set up in 2011 could not be re-located in 2012, and some target species had zero recruitment.