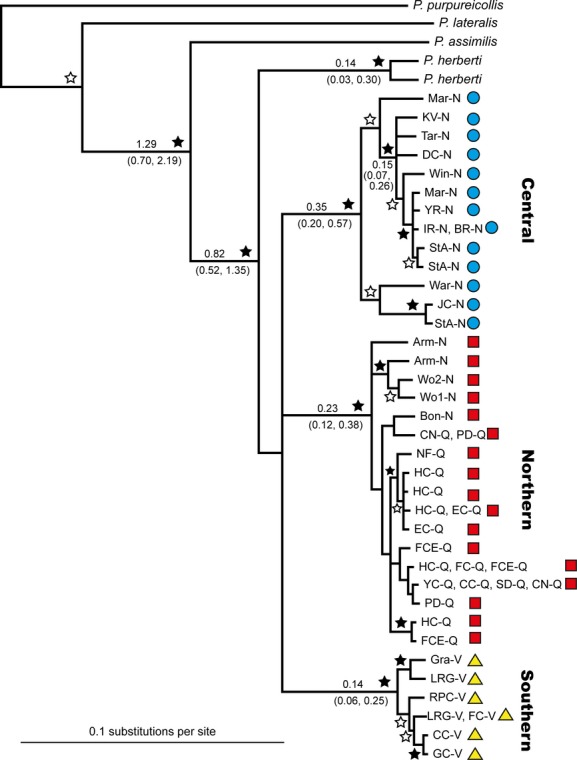
Figure 3.

Bayesian 50% majority-rule consensus tree for the 36 brush-tailed rock-wallaby control region haplotypes obtained in this study. Black stars indicate ≥95% posterior probability node support, white stars indicate node support of ≥70%, other nodes present have posterior support of 50–69%. Numbers on branches are node ages in millions of years, with 95% highest posterior density bounds in parentheses. The three identified brush-tailed rock-wallaby mitochondrial lineages are indicated by red squares, Northern lineage; blue circles, Central lineage; and yellow triangle, Southern lineage. Population abbreviations are as in Table 1.
