Figure 4.

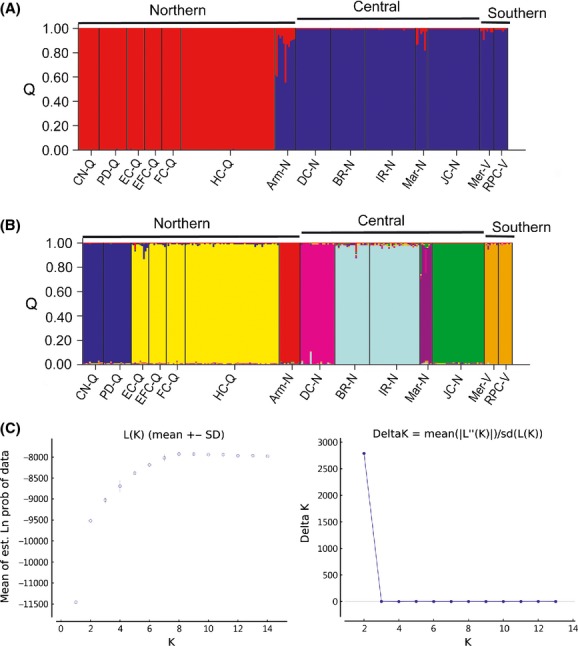
Stucture plots showing proportions of inferred ancestry (Q) in the genetic clusters identified within brush-tailed rock-wallabies sampled from 14 sites, when (A) K = 2 or (B) K = 8. (C) Structure output showing maximum L(K) at K = 8 and maximum ΔK at K = 2. See Table 1 for population abbreviations. (A) Identified clusters when K = 2 (B) Identified clusters when K = 8. (C) Graphs of Structure output showing maximum L(K) at K = 8 and maximum ΔK at K = 2.
