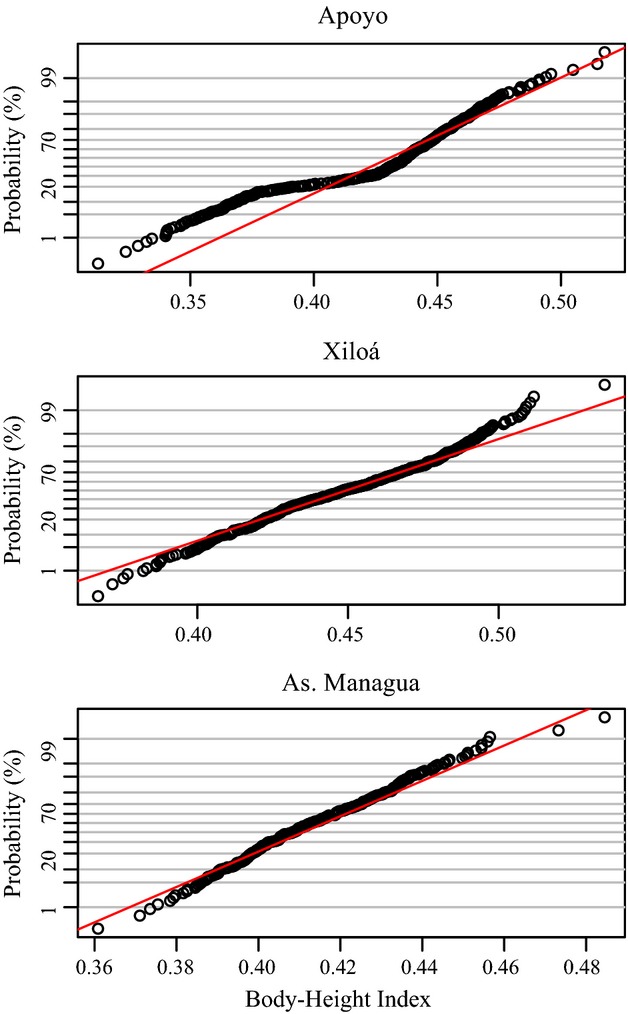
Figure 5.

Distribution of body height index across lakes. Normal probability plots with cumulative proportions of observed versus expected proportions of body height index (BHI) in comparison to a single normal distribution (red line) for lakes Apoyo, Xiloá and Asososca Managua. Trait distributions for lakes Apoyo and Xiloá are best explained by two components while in Asososca Managua they are most likely explained by one (see section “Results”).
