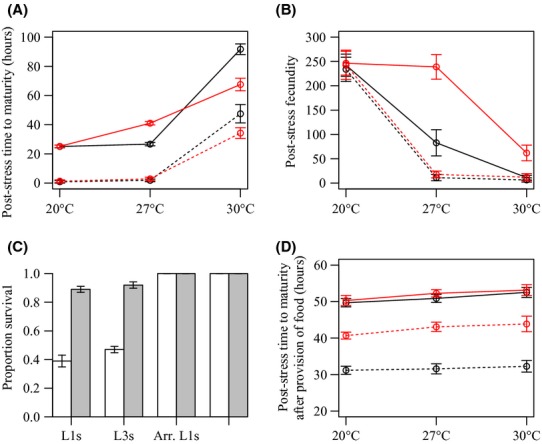
Figure 2.

Gene-by-environment interactions. Life-history responses to thermal stress in wild-type individuals (black lines in A, B, and D; white bars in C) and age-1 (hx456) mutants (red lines in A, B, and D; gray bars in C). Solid lines represent L1s maintained with ad lib food (A and B) or arrested L1s (D), and broken lines represent L3s maintained with ad lib food (A and B) or dauers (D). Figures represent (A) mean times to maturity after the thermal stress period in individuals maintained with ad lib food availability during development, (B) mean fecundity (number of offspring per adult) after the thermal stress period in individuals maintained with ad lib food availability during development, (C) mean proportions of wild-type and age-1(hx546) mutant individuals which survived following exposure to 30°C during the L1, L3, arrested L1 (Arr.L1) and dauer larval stages, and (D) mean times to maturity after the thermal stress period and after food had been provided in individuals that had arrested development in the L1 diapause stage or the dauer stage. In all plots, error bars represent standard errors of the means. Time to maturity and survival data are presented for five temporally replicated blocks, and fecundity data are presented for three temporally replicated blocks.
