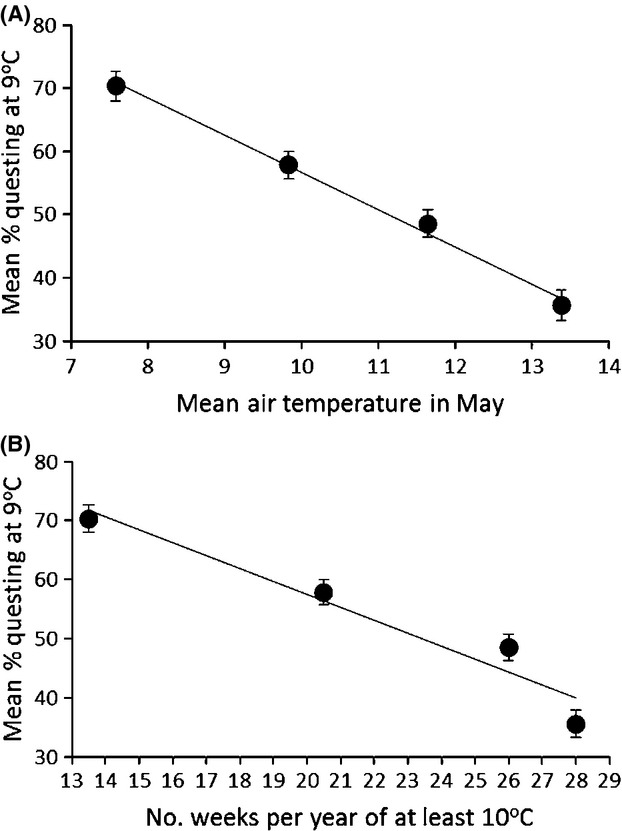
Figure 5.

The association between the proportion of nymphs questing at 9°C from the experiments and (A) mean temperature in May and (B) the number of weeks per year of at least 10°C. The line of best fit, unadjusted means, and standard error bars are shown.
