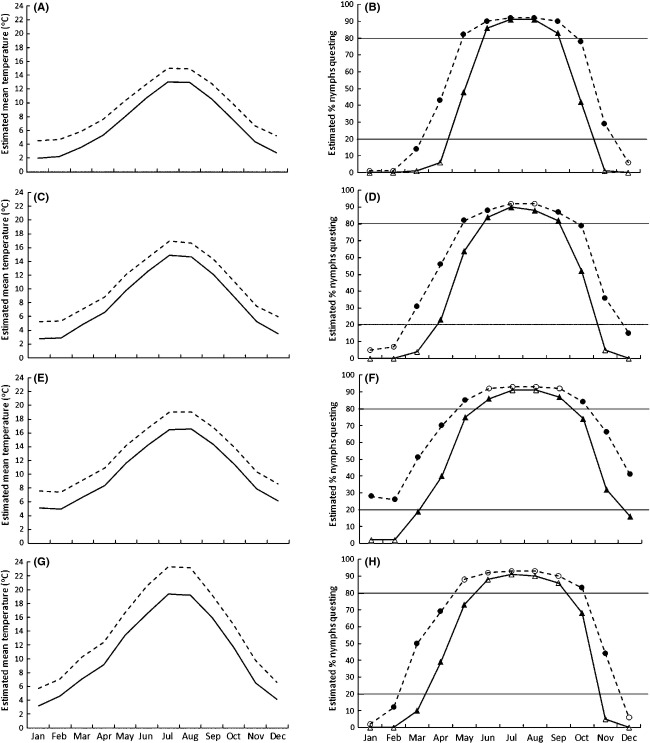
Figure 6.
Estimated mean monthly temperatures (left hand side) and projected mean percentage of active nymphs questing (right hand side) for current (1970–2000; solid lines) and future (2080–2099; dashed lines) temperature estimates for each tick sampling site (A and B: northeast Scotland; C and D: North Wales; E and F: South England; G and H: central France). See text for details of temperature estimation methods. Filled (black) symbols indicate the more robust estimates of the percentage of active nymphs questing because the temperatures were used in the experiment; unfilled (white) symbols indicate values estimated by extrapolation because they relate to temperatures not used in the experiment. Horizontal lines are placed where 20% and 80% nymphs are predicted to be questing as a visual aid.

