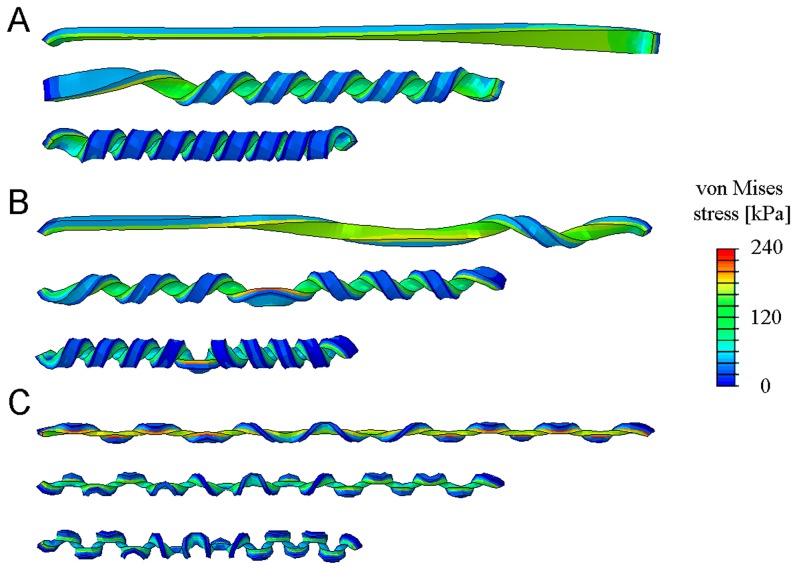
Figure 4. Snapshots recorded from the finite element simulations, illustrating the formation of (A) a helix, (B) a hemihelix with single perversion and (C) a hemihelix with 12 perversions.
The colors represent the local values of the computed von Mises stress. The prestrain  was the same in all three cases.
  ,
,  , (A)
, (A)  , (B)
, (B)  , (C)
, (C)  . The images are taken when the end to end distances are
  . Gravity was included in the simulations and acts from left to right in these images.

