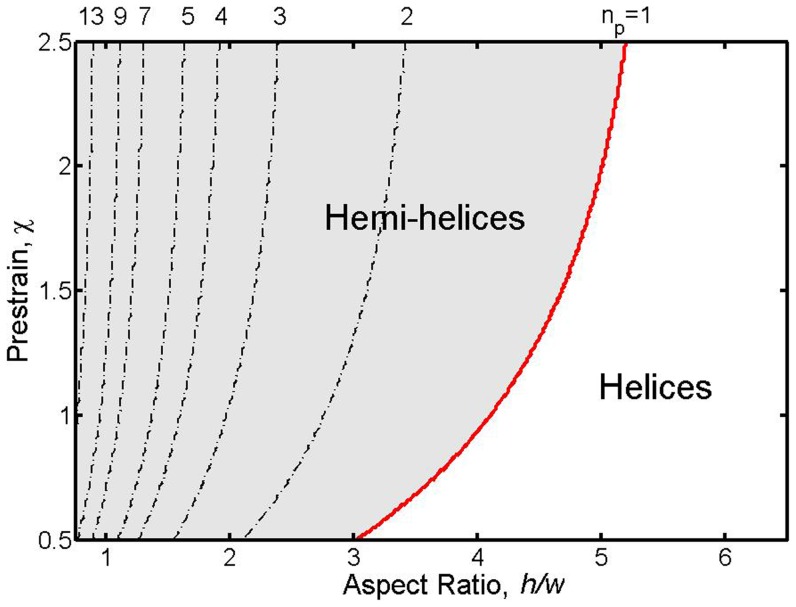
Figure 8. Contour plots showing the value of  for which the growth rate is maximum as function to
  and
and  .
.
The growth rates are calculated for  . Black dotted lines show the boundaries between modes with different number of perversions
  , while the red line corresponds to
  and separates hemihelices (on its left) from helices (on its right). For clarity not all the higher modes are shown.

