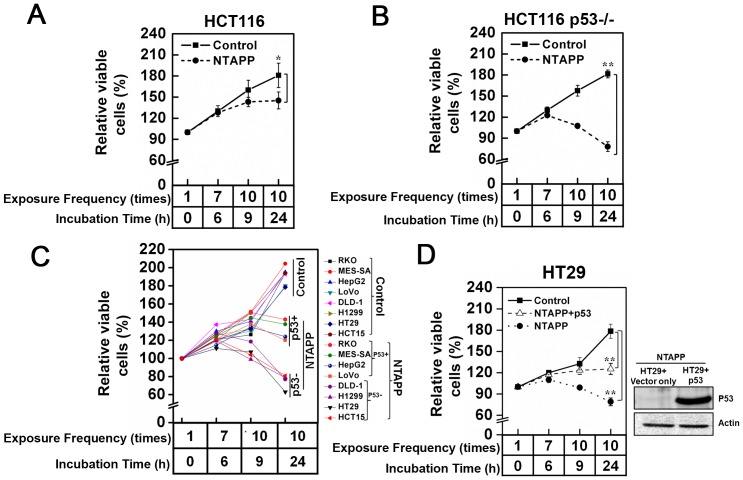
Figure 4. Highly preferential anti-proliferative effect of NTAPP on cancer cells without functional p53.
(A–D) Indicated cancer cell lines were exposed with 5 V input NTAPP for 30 s every h for 10 times, and cell viability was evaluated at each indicated exposure frequency. Incubation time indicates the time after the initial NTAPP exposure. The 24 h incubation was prepared with 10 repetitive NTAPP exposures followed by further incubation for 15 h. The relative percentages of viable cells are shown comparing the initial cell number prior to exposure and incubation as 100%. Viable cells were quantified with MTT assays, and data are shown as mean ± SEM from three independent experiments. p<0.05 (*) and p<0.01 (**) indicate significant differences compared with the control condition. (A, B) After NTAPP exposure, the relative percentage of viable cells were plotted for (A) HCT116 (p53+/+) and (B) HCT116-E6 (p53−/−), both of which have the same genetic background except for the (A) presence and (B) absence of functional p53. (C) The relative percentages of viable cells were plotted together after the same NTAPP exposures in p53-proficient cells (RKO, MES-SA, HepG2, G361, LoVo) and p53-deficient cells (DLD-1, H1299, HT29, HCT115). (D) p53-deficient HT29 cells were transfected with pcDNA-p53-HA, and the expression of p53 in HT29 was verified by a western blot shown on the right side with actin as a loading control. The relative percentages of viable cells in HT29 and p53-transfected HT29 cells were plotted after the same NTAPP exposures.

