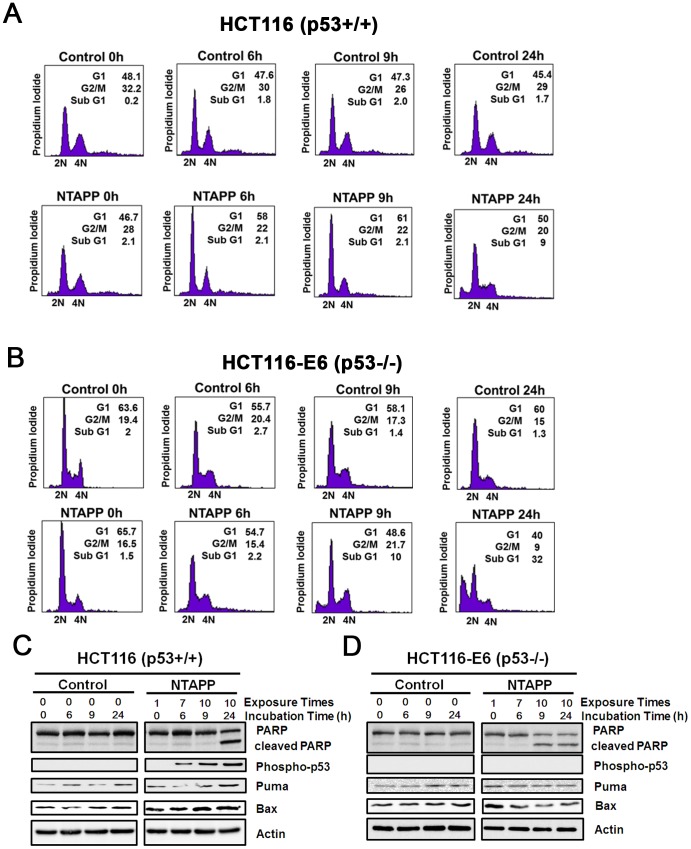
Figure 5. p53 activation and G1 cell cycle delay by NTAPP in p53-proficient cancer cells.
(A, B) HCT116 (p53+/+) and (B) HCT116-E6 (p53−/−) cells were exposed with 5 V input NTAPP for 30 s every h for maximum 10 times, and DNA content was evaluated by flow cytometry after propidium iodide staining at each indicated incubation time, which indicates the time after initial exposure to NTAPP. The 24 h incubation sample was prepared with 10 repetitive NTAPP exposures followed by further incubation for 15 h. (C, D) In the same NTAPP-exposed samples of (A, B), PARP, cleaved PARP, Ser 15 phophorylated p53, Puma and BAX were assessed respectively by western blot analyses. Actin is shown as a loading control.

