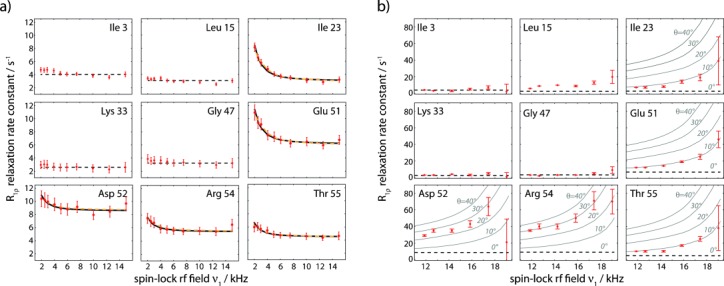
Figure 2.

Experimental 15N RD data obtained on perdeuterated ubiquitin at 300 K, obtained from proton-detected experiments. Plotted is the on-resonance R1ρ, that is, corrected for chemical-shift offset (see the Supporting Information). a) RD profiles obtained at 39.5 kHz MAS and low spin-lock rf field strengths of 2–15 kHz. Solid black lines show the result of a Bloch–McConnell fit of a two-state exchange model using only R1ρ-derived data, while orange lines are derived from a fit that includes CPMG data for residues 23, 27, and 55 at 600 MHz, as reported earlier (see Figure S8). Straight dashed lines (constant R1ρ rate) in panels (a) and (b) show the relaxation rate constant obtained at 39.5 kHz MAS and 15 kHz spin-lock field strength, which is considered as free from exchange effects. b) RD profiles obtained at 20 kHz MAS on a fully deuterated, 20 % reprotonated sample of ubiquitin. Solid lines show simulated R1ρ RD profiles assuming an exchange rate kex=2900 s−1 and population pB=9.3 %. All available RD profiles, as well as experimental details are shown in the Supporting Information.
