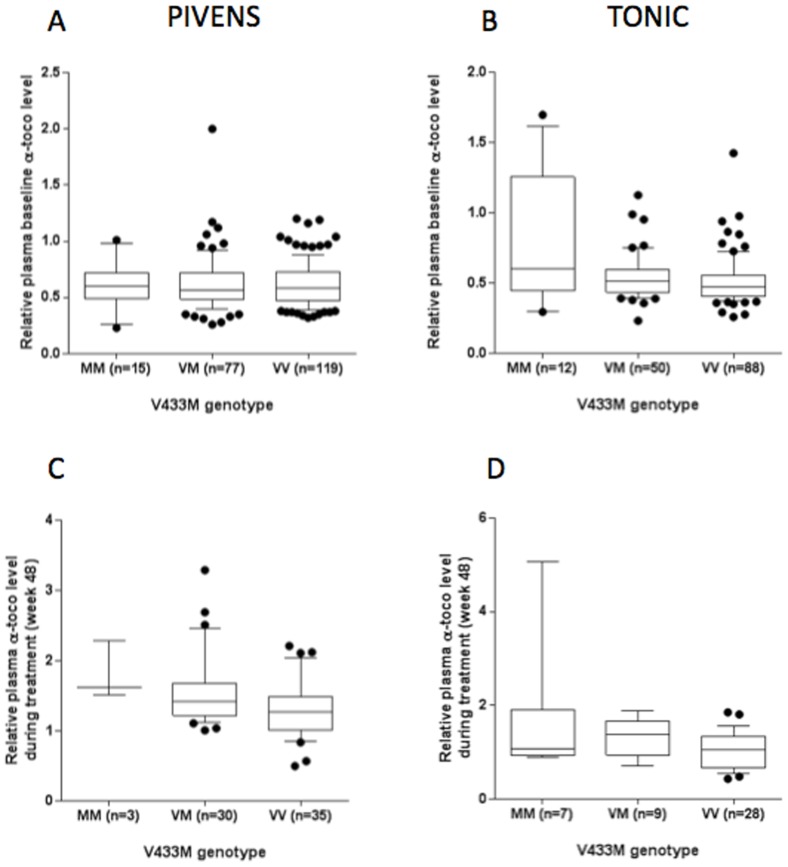
Figure 1. Association between CYP4F2 V433M polymorphism and α-tocopherol levels at baseline (entire cohort) and during the intervention phase (in Vit E treated participants) in PIVENS and TONIC trials.
Data shown in Box (horizontal bar in the box indicates median) and whiskers plot (with 10–90 percentile). Panel A: Relationship between V433M genotype and baseline α tocopherol level in PIVENS (p = ns). Panel B: Relationship between V433M genotype and baseline α tocopherol level in TONIC (p = 0.004). Panel C: Relationship between V433M genotype and week 48 α tocopherol level in PIVENS (p = 0.004). Panel D: Relationship between V433M genotype and week 48 α tocopherol level in TONIC (p = 0.0002).

