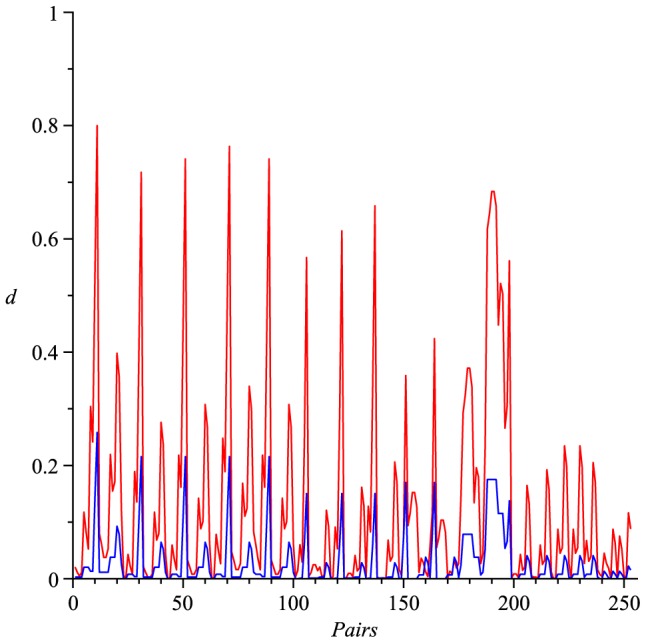
Figure 2. Values of  (red) and
  (blue).

The Y-axis denotes the values of the distance measure and the X-axis denotes the graph pairs.
 (red) and
  (blue).
The Y-axis denotes the values of the distance measure and the X-axis denotes the graph pairs.