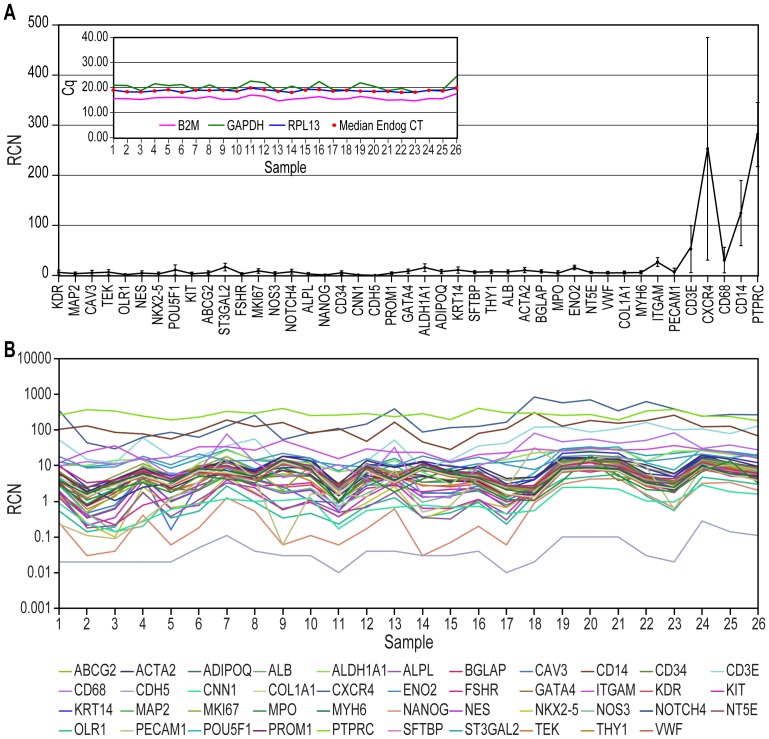
Figure 1. qRT-PCR quantification of gene expression in PBMCs from a sample of a healthy human population.
A. The average expression levels (indicated as the relative copy number, RCN = 2−ΔCq×100) of the tested genes ordered based on the strength of their covariation (compare to Fig. 2A). The data are expressed as the means ± SD. Inset. Cq values for housekeeping genes used as endogenous controls. Of note, the large SD displayed by CXCR4 was due not to outliers but to the skewness of the data distribution. B. Actual RCN values of the 45 tested genes in 26 healthy subjects, indicating the coordinated expression of the majority of the genes (conventional color coding).

