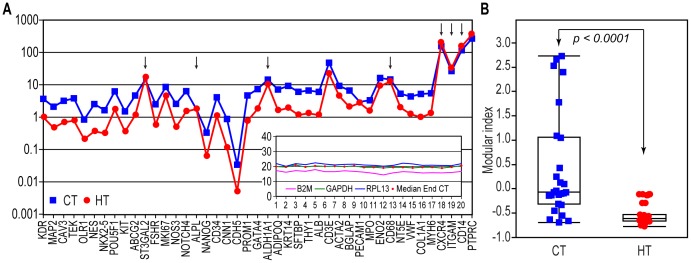
Figure 7. Comparison of gene expression in healthy and hypertensive subjects.
A. The median RCN in healthy controls (CT, blue) vs. hypertensive patients (HT, red); all of the differences are significant (p<0.05), with the exception of those labeled by arrows. Inset. Cq values of housekeeping genes in this patient population. B. Box plots of the aggregated MI (averages of normalized RCN values of Module 1 genes) in the control subjects and patients. (Box plots show the median values, 1st and 3rd quartiles, and the interquartile range; symbols are as in A).

