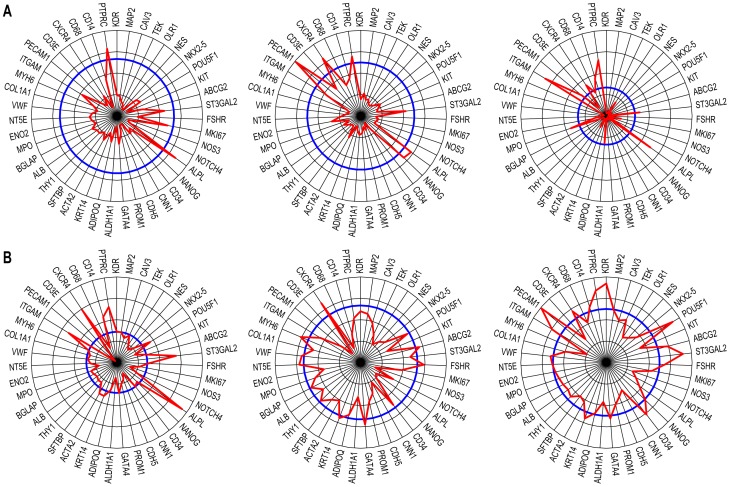
Figure 9. Radial representation of relative gene expression in hypertensive patients.
A. Representative radial diagrams of patients with hypertension. Note the overall reduction in expression, with the exception of a subgroup of genes (e.g., ALPL, ITGAM, and PTPRC/CD45; compare with Fig. 7A). B. Radial diagrams of hypertensive patients treated with thiazide; in these cases, the gene patterns in the two modules were closer to normal (i.e. closer to the blue reference line).

