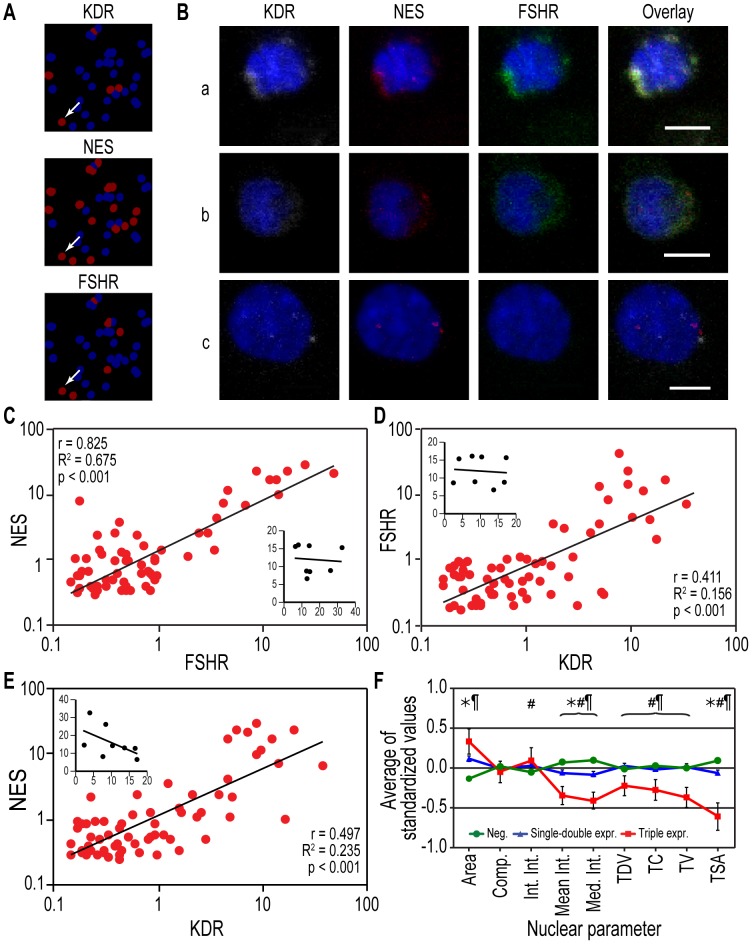
Figure 10. Origins of marker gene co-expression within individual cells: in situ hybridization (ISH).
A. ISH analysis of the Module 1 hub genes KDR and NES and the node gene FSHR, identified by their fluorescent signals in a given microscopic field (brown masks were added to positive cells by the CellProfiler image analysis software; blue represents DAPI staining of nuclei). Arrow: a triple-positive cell. B. Four-color confocal images of cells that are positive for (a) all three markers; (b) NES and FSHR only; or (c) KDR and NES only (white: KDR; red: NES; green: FSHR; blue: nuclei). Bars: 5 µm. C–E. Linear regression of the integrated pixel intensity of the mRNA of each marker gene (KDR, NES, and FSHR) detected using ISH in triple-positive cells (n = 66 cells pooled from 8 individuals; r: Pearson's correlation coefficient; r2: regression coefficient; log-log scale). Inset graphs show the lack of correlation between mRNA expression (also measured as the integrated pixel intensity) in single-positive cells for each respective pair of markers. F. Nuclear area and several texture features calculated using the CellProfiler analysis significantly separated the triple-positive cells from the other cells (*, p<0.05 for single and double expressers vs. negatives; #, p<0.05 for single and double expressers vs. triple positives; ¶, p<0.05 for triple expressers vs. negatives) (a total of 2094 cells from 8 subjects were analyzed). Abbreviations: Comp., compactness; Int. Int., integrated intensity; Mean Int., mean intensity; Med. Int., median intensity; TDV, texture difference variance; TC, texture contrast; TV, texture variance; TSA, texture sum average. The data represent the means of standardized values ± SEM.

