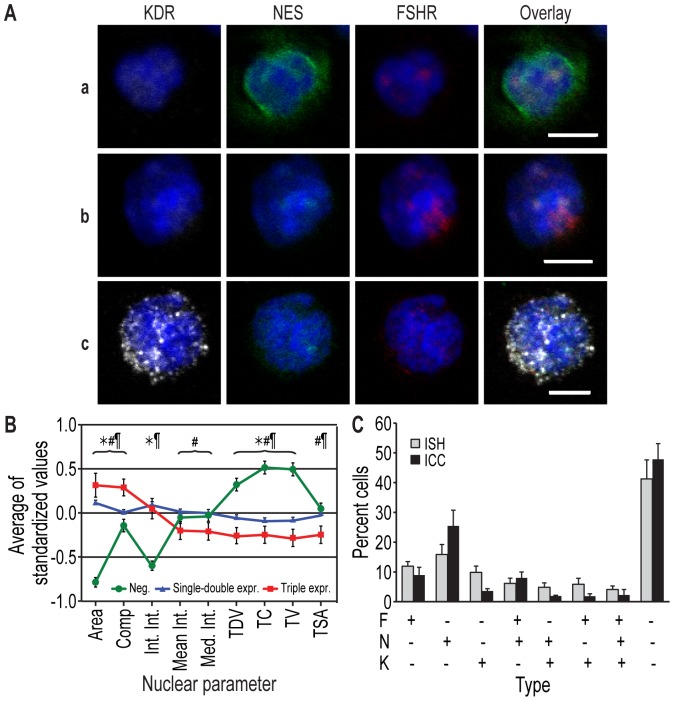
Figure 11. Detection of cells expressing representative Module 1 node proteins using immunocytochemistry (ICC).
A. Cells expressing various levels of KDR (white), NES (green), and/or FSHR (red). Nuclei are blue (DAPI). a, b: NES-FSHR double-positive cells; c: a triple-positive cell. Bars: 5 µm. B. A nuclear morphology analysis revealed alterations in the triple-positive cells detected using ICC that were comparable to those found using ISH (see Fig. 10 for abbreviations). The data represent the means of standardized values ± SEM; a total of 1655 cells were analyzed. C. Frequencies of cells positive for the three marker genes, detected using ISH (gray bars) and ICC (black bars) (n = 2094 and 1655 cells, respectively; none of the inter-method comparisons were significant, demonstrating that they detected the same cell populations). The data represent the means of individual blood donors ± SEM.

