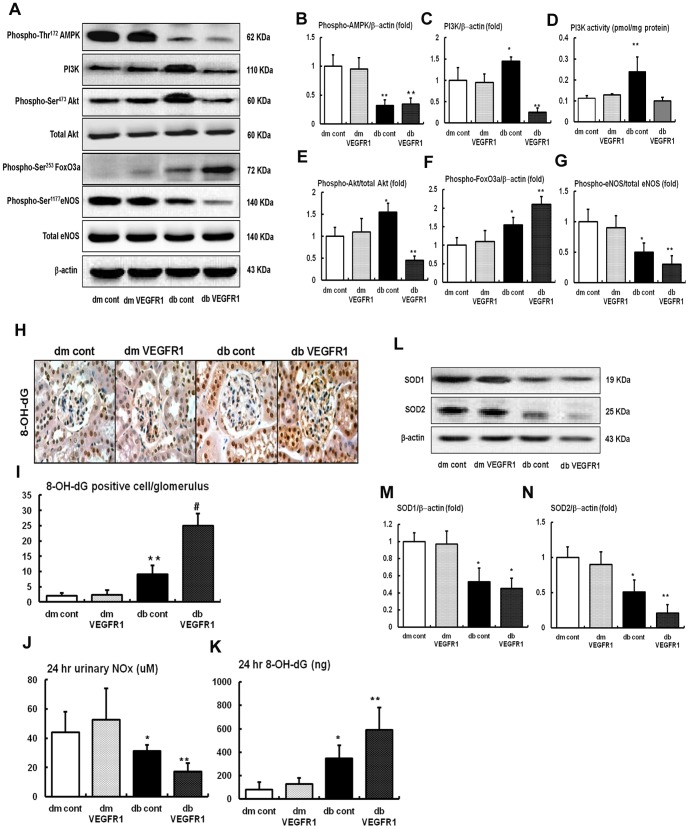
Figure 4. Phospho-Thr172 AMPK, total AMPK, PI3K level and activity, phospho-Ser473 Akt, total Akt, phospho-Ser453 FoxO3a, phospho-Ser1177 eNOS, total eNOS and SOD1, SOD2 expressions in the renal cortex and 24-h urinary NOx, 8-OH-dG concentrations of the db/m and db/db mice with or without VEGFR1 inhibition.
(A to G) Representative Western blot analysis of the phospho-Thr172 AMPK, total AMPK, PI3K, phospho-Ser473 Akt, total Akt, phospho-Ser453 FoxO3a, phospho-Ser1177 eNOS, total eNOS and β-actin expression and the quantitative analyses of the results are shown. (L to N) Representative Western blot analysis of the SOD1, SOD2 and β-actin expression and the quantitative analyses of the results are shown. (H to K) Representative 24-h urinary NOx, 8-OH-dG concentrations of the results are shown. *P<0.05, **P<0.01 compared with db/m mice groups.

