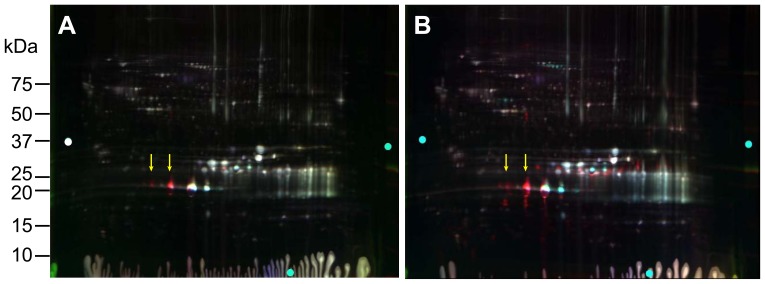
Figure 1. 2D-DIGE analysis of proteomic changes in whole lenses of 2-day-old mice with knock-in of the αA-R49C mutation.
(A) 2D gel of cyanine dye-labeled lens proteins derived from wild-type sample 1 (WT1) proteins labeled with Cy2, WT2 proteins labeled with Cy3, and αA-R49C heterozygous proteins labeled with Cy5. (B) 2D gel of cyanine dye-labeled lens proteins derived from WT1 proteins labeled with Cy2, WT2 proteins labeled with Cy3, and αA-R49C homozygous proteins labeled with Cy5. Protein spots that were selected for analysis from the gels shown in (A) and (B) are shown in Fig. S1 in File S1 and were identified by tandem mass spectrometry and Mascot searches. Quantitative image analysis and mass spectrometry data for the identified proteins are listed in Table 1. Arrows indicate the shift in position of the αA-crystallin bands (red) to a more acidic pI with the mutation.

