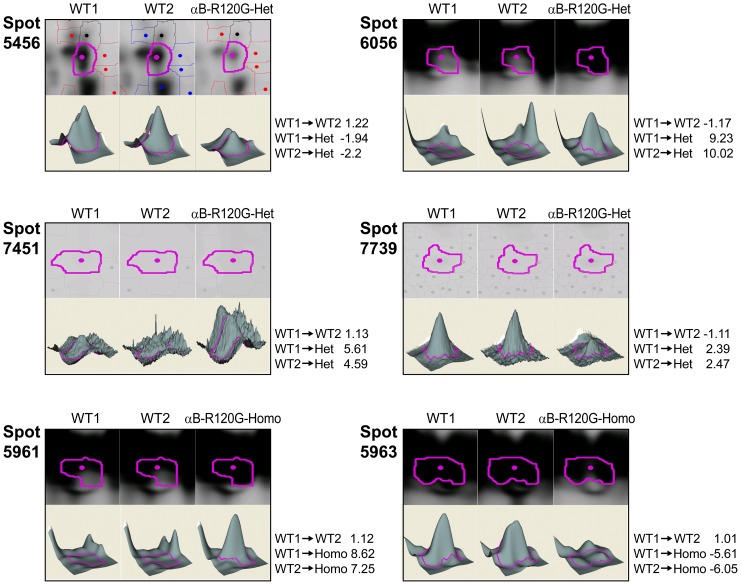
Figure 7. Quantitative analysis of the changes in abundance of proteins in postnatal 14-day-old lens from WT and αB-R120G knock-in mice by mass spectrometry.
The 3D data sets for representative proteins in two WT (WT1 and WT2) and one αB-R120G mutant sample are shown. (A) WT1 and WT2 proteins were labeled with Cy3 and Cy5 dyes, respectively, and αB-R120G heterozygous mutant lenses with Cy2. (B) WT1 and WT2 proteins were labeled with Cy2 and Cy3 dyes, respectively, and αB-R120G homozygous mutant lenses with Cy5. Fold changes between each sample are indicated on the right. See Table 4 for the identity of proteins present in each protein spot.

