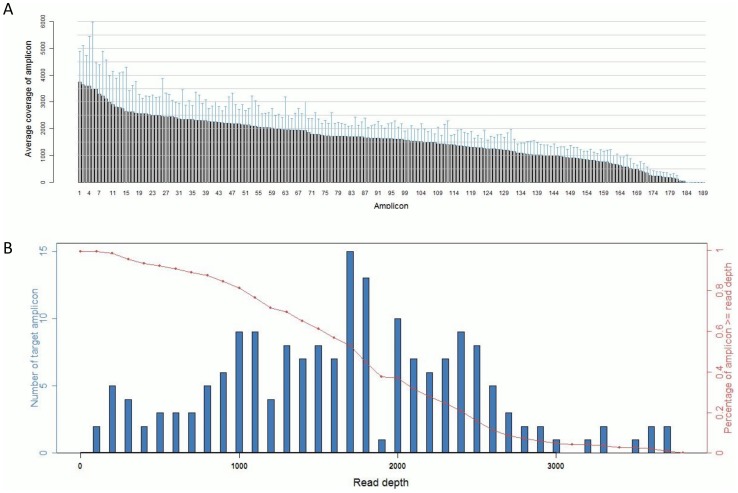
Figure 1. Sequence read distribution across 189 amplicons generated from 76 FFPE specimens, normalized to 300,000 reads per sample.
A. Distribution of average coverage of each amplicon. Data are showed as mean ±SD. B. Number of amplicons with a given read depth, sorted in bins of 100 reads. (blue bars present number of target amplicons within read depth, red line presents % of target amplicons > = read depth).

