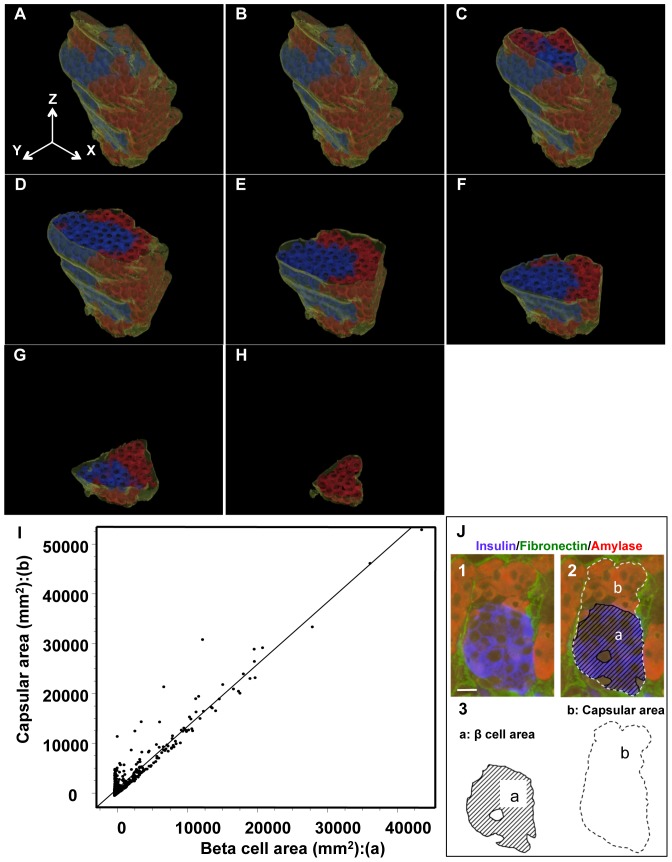
Figure 3. Reconstructed feature of islet cell cluster, acinar-like cell cluster, and BMs and ECM.
A–H: Overview of the architecture reconstructed by serial pancreatic beta cell clusters (insulin: blue) and acinar-like cell clusters (amylase: red) surrounded by continuous BMs and ECM (fibronectin: green). I, J: Relationship between the beta cell area (X-axis) and the capsular area (Y-axis), which contains the beta cell area and the acinar-like cell area. A clear linear correlation between beta cell area and capsular area was observed (p<0.001, n = 517). See the schematic definition in (J). J 1–3: Schematic definition of capsular area and acinar-like cell area. The capsular area (b: dashed line) is composed of the acinar-like cell area (red in the dashed line) and the islet cell area (a: blue) (mostly beta cell area). A good correlation between the capsular area and islet cell area (Figure 3-I) indicates that a constant proportion of islet cell clusters are accompanied by acinar-like cell clusters irrespective of the size of beta cell clusters.

