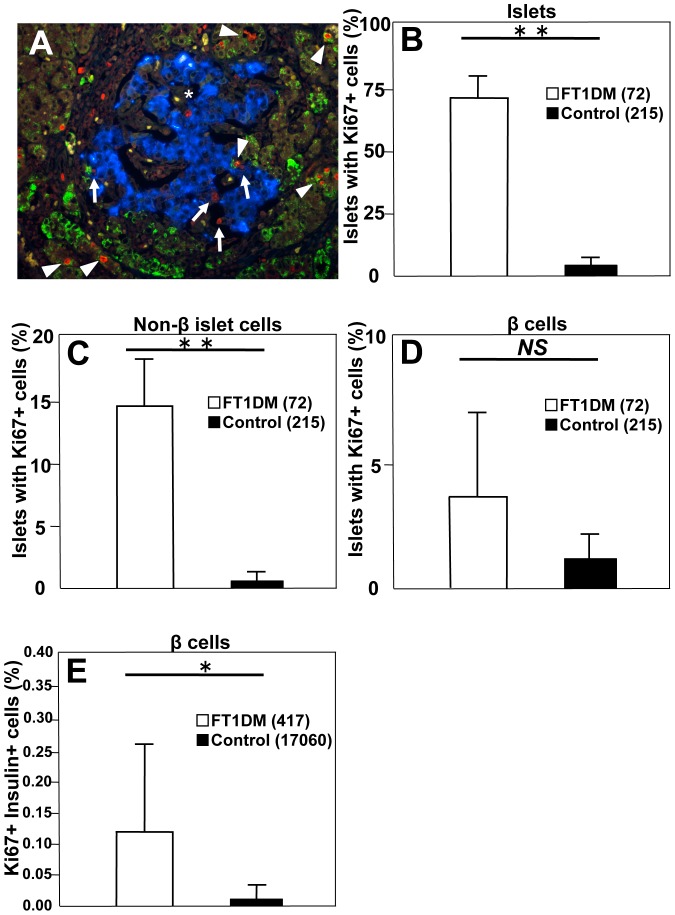
Figure 7. Replicating islet cells in fulminant type 1 diabetes (FT1DM).
A: Ki67-positive cells are increased in the pancreas of FT1DM. The cell composition of increased Ki67+ cells (red nuclei) is mainly REG Iα positive cells (green: arrowheads), islet non-beta cells (arrows), and islet beta cells (*, blue). B: The percentage of islets positive for Ki67 is increased in the pancreas of FT1DM. The number in parentheses indicates the total number of islets studied in FT1DM and control. See the detailed characterization of the subjects in Research Design and Methods. **P<0.0001 vs. controls, mean ± SEM. C: The number of islets positive for Ki67 in non-beta islet cells is increased in FT1DM. Non-beta islet cells were stained by mixed antisera for glucagon, somatostatin, and pancreatic polypeptide, and the values are expressed as percentage of islets positive for Ki67. The number in parentheses indicates the total number of islets studied in FT1DM and controls. **P = 0.02 vs. controls, mean ± SEM. D: The number of islets positive for Ki67 in beta cells tends to increase, but it is not significant due to the markedly decreased number of beta cells in individual islets in FT1DM. The number in parentheses indicates the total number of islets studied in FT1DM and controls. E: The number of Ki67-positive beta cells is increased in FT1DM. The numbers in parentheses indicate the total number of beta cells counted in the islets of FT1DM and controls. See a detailed characterization in Research Design and Methods. *P = 0.043 vs. controls, mean ± SEM.

